> For the complete documentation index, see [llms.txt](https://docs.reachplatform.com/llms.txt). Markdown versions of documentation pages are available by appending `.md` to page URLs; this page is available as [Markdown](https://docs.reachplatform.com/operations-and-reporting/standard-reports-and-dashboards.md).
# Standard Reports & Dashboards
Out-of-the-box dashboards and reports in Reach Central for operations, support, growth, usage, and revenue.
### Overview
Reach Platform includes a **standard reporting and analytics layer**. It provides visibility into **business performance**, **operations**, **customer lifecycle**, and **revenue**.
**Dashboards** and **reports** are included for all Reach Platform brands. They do not require **custom development**. They support **day-to-day operations** and **executive reporting**.
### Audience
* Operations and program management
* Customer support leaders and supervisors
* Growth and marketing stakeholders
* Product and business owners
* Finance teams
* Executives
{% hint style="info" icon="circle-user-circle-question" %}
For detailed report definitions and the full reports stack, contact your Brand Account Manager.
{% endhint %}
### Access in Reach Central
All standard dashboards and reports are accessed in the **Reach Central** portal.
* **Dashboards**: visual, near-real-time monitoring
* **Reports**: detailed, downloadable views for operations and reconciliation
{% hint style="info" %}
Access is role-based. Users only see the data and modules permitted by their role.
{% endhint %}
If your agents authenticate via SSO, see [SSO — Agents](/customizations-and-bolt-ons/bolt-ons-catalog/sso-agents.md).
### Standard dashboards
These dashboards are included by default for every Reach Platform brand.
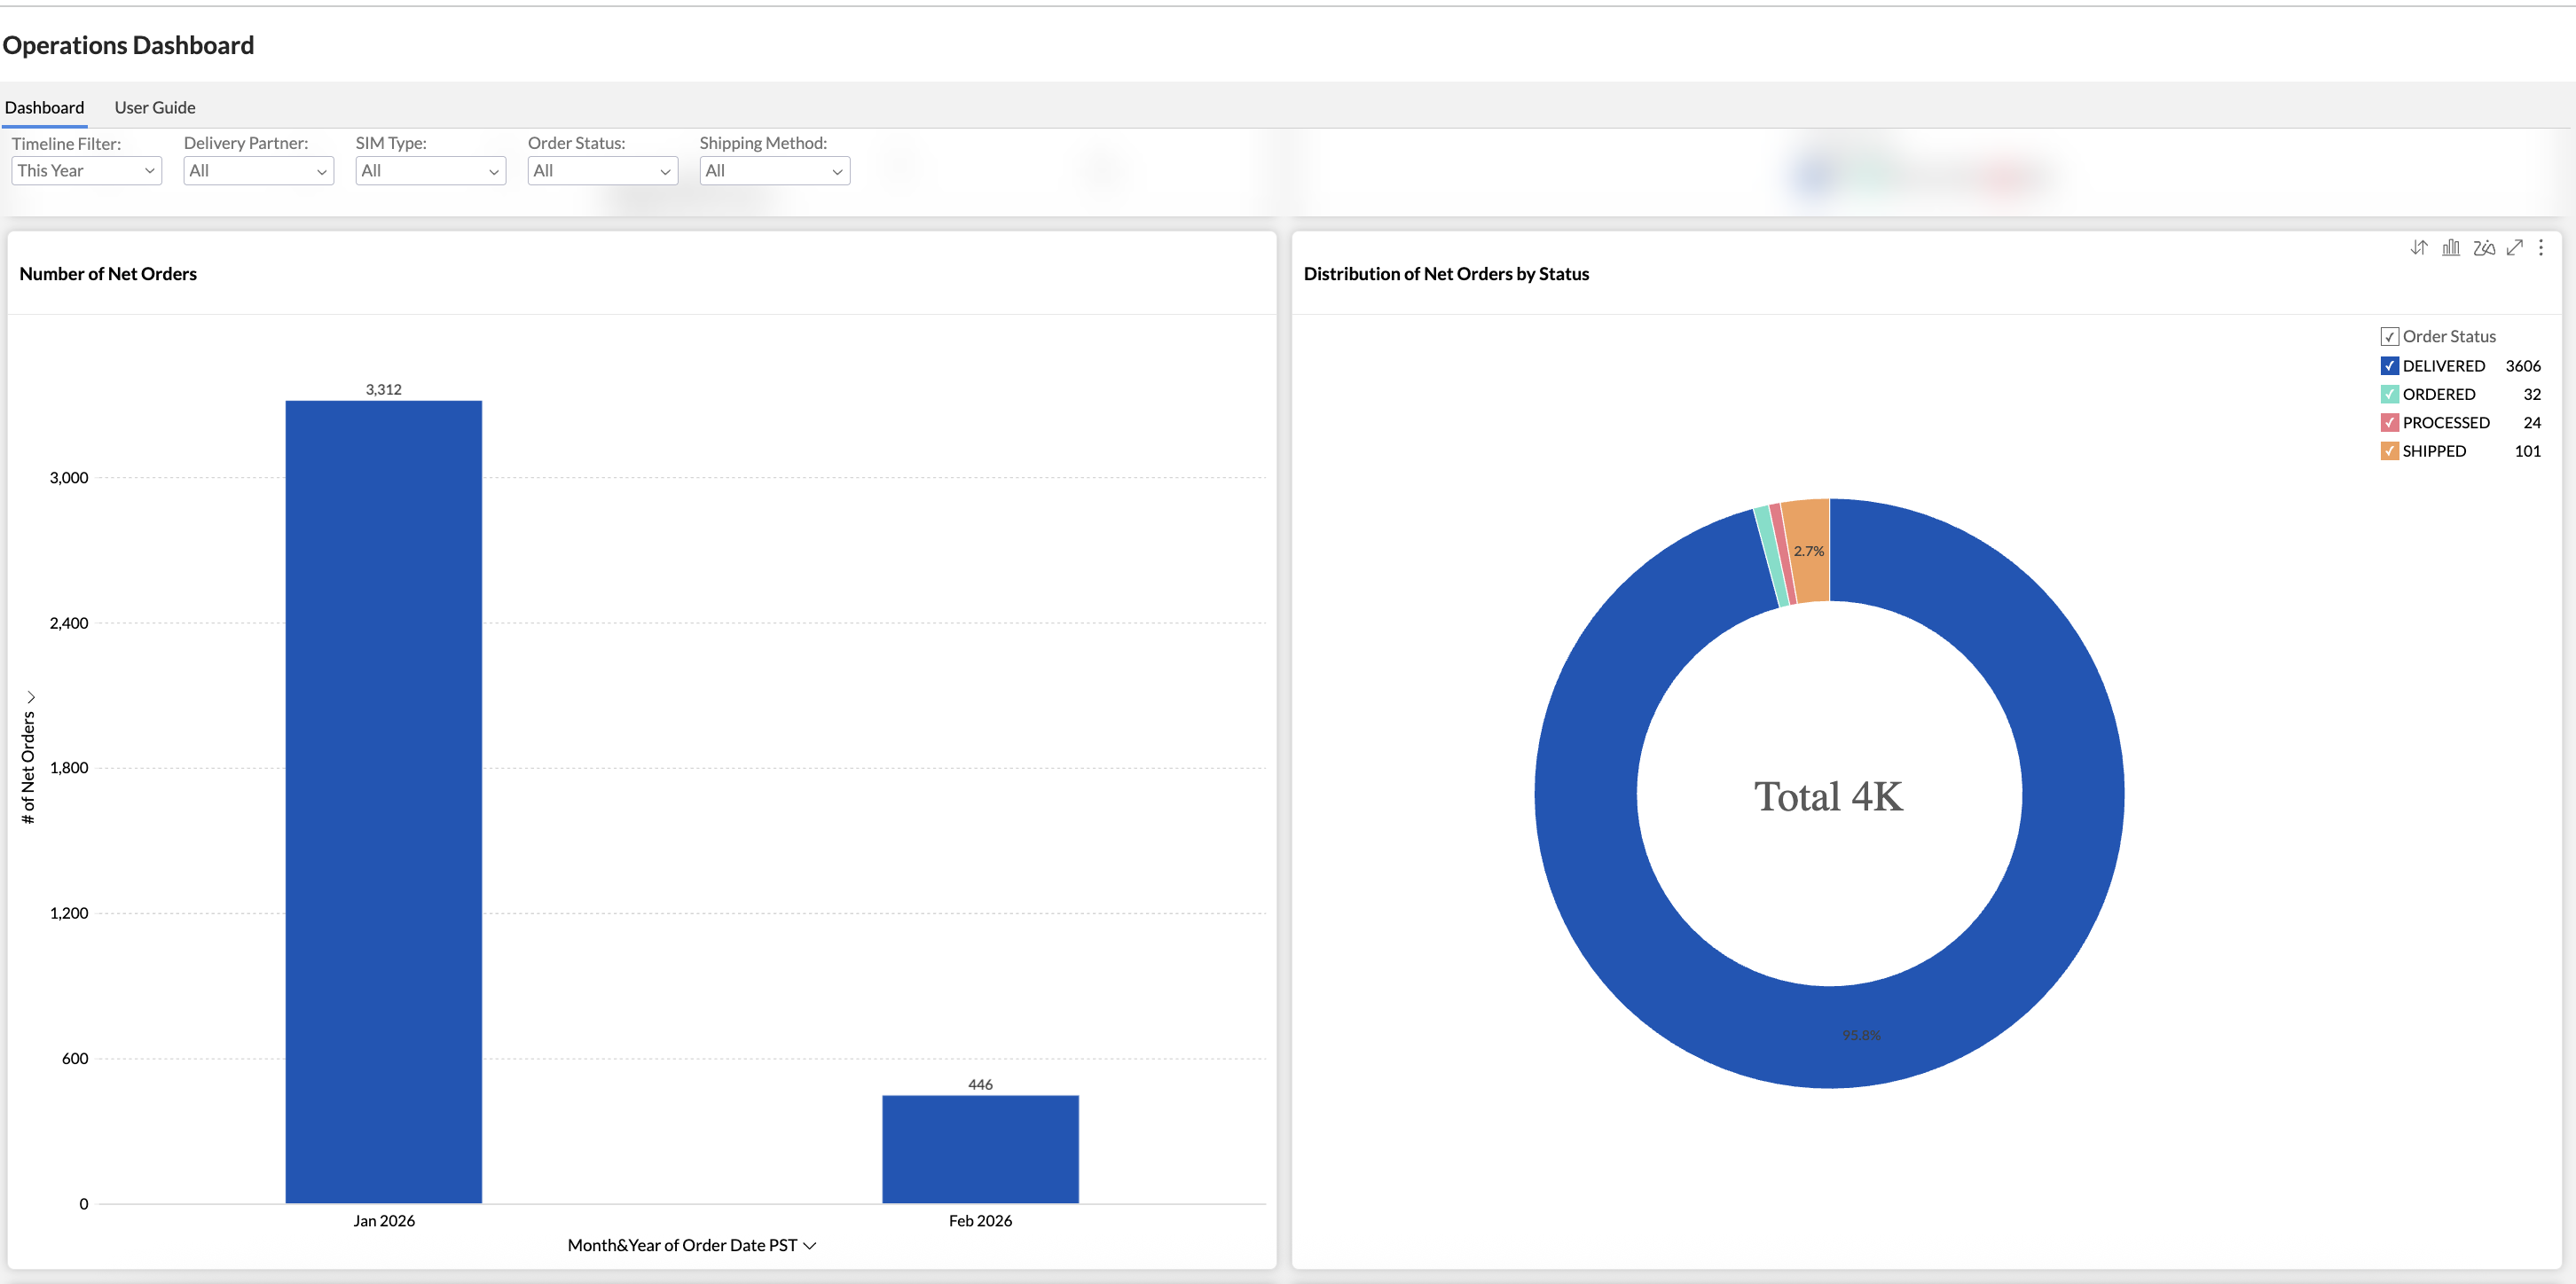
#### Operations dashboard
Operational health across activations, provisioning status, port-in/port-out activity, and success/failure trends.
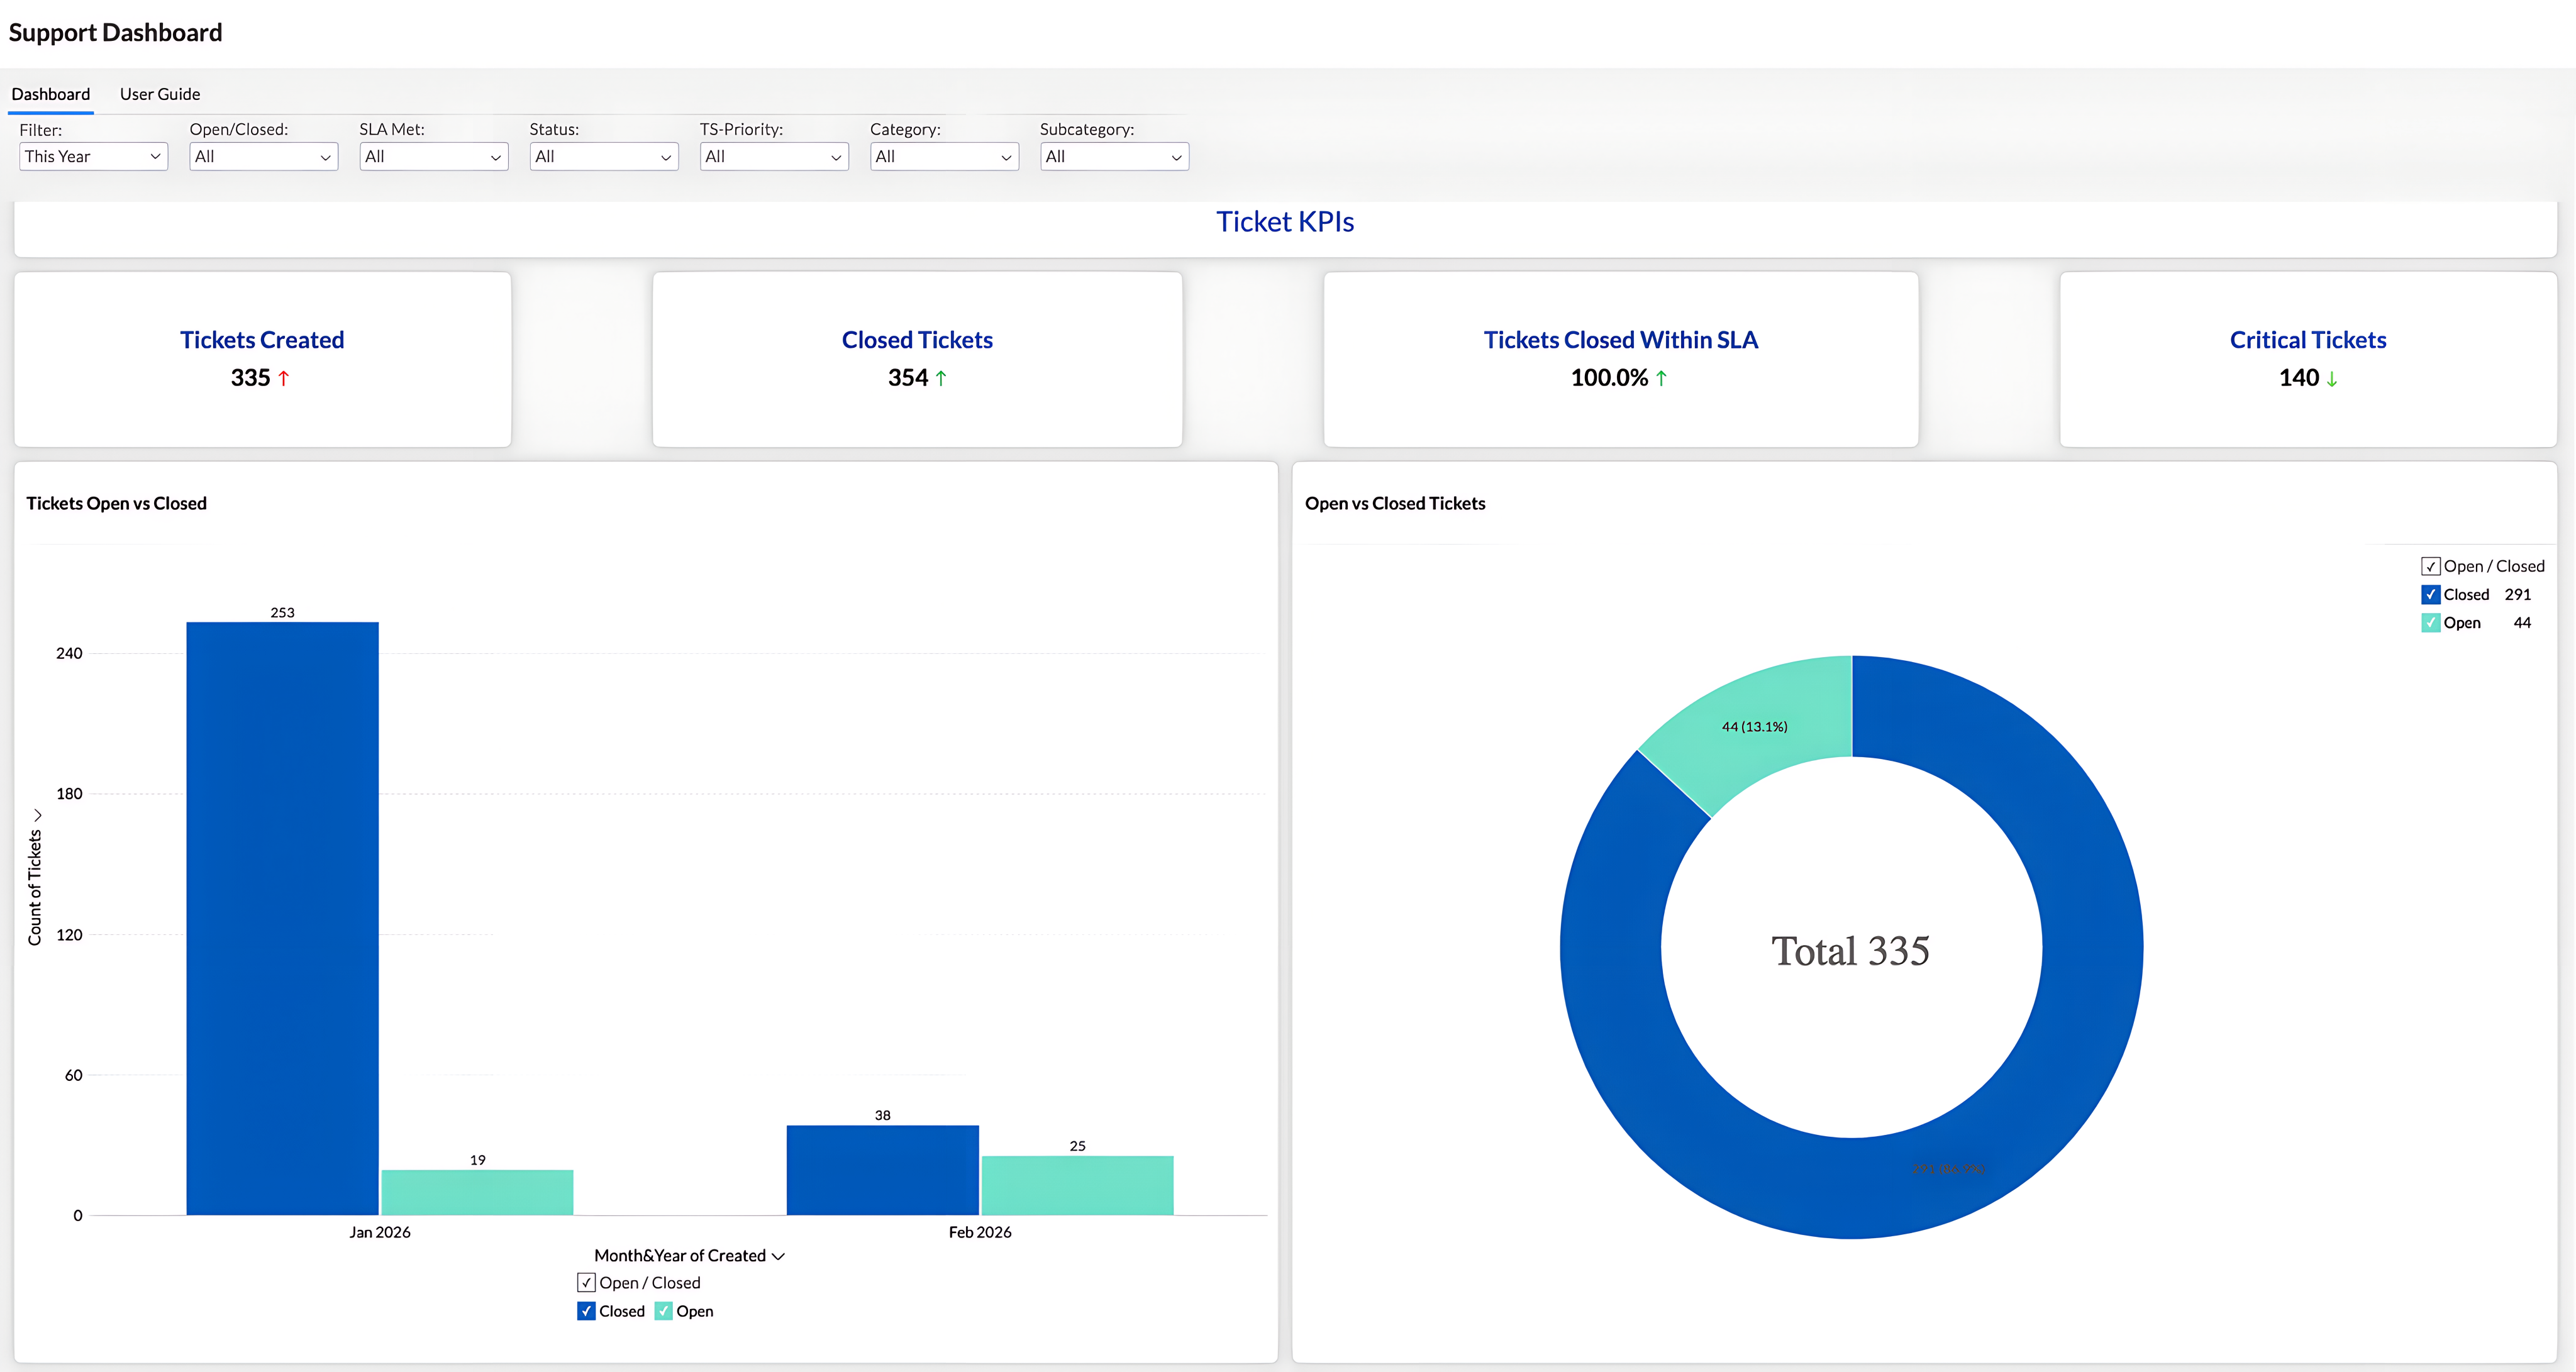
#### Support dashboard
Support workload and efficiency. Includes ticket volume trends, open vs. resolved cases, and escalation visibility.
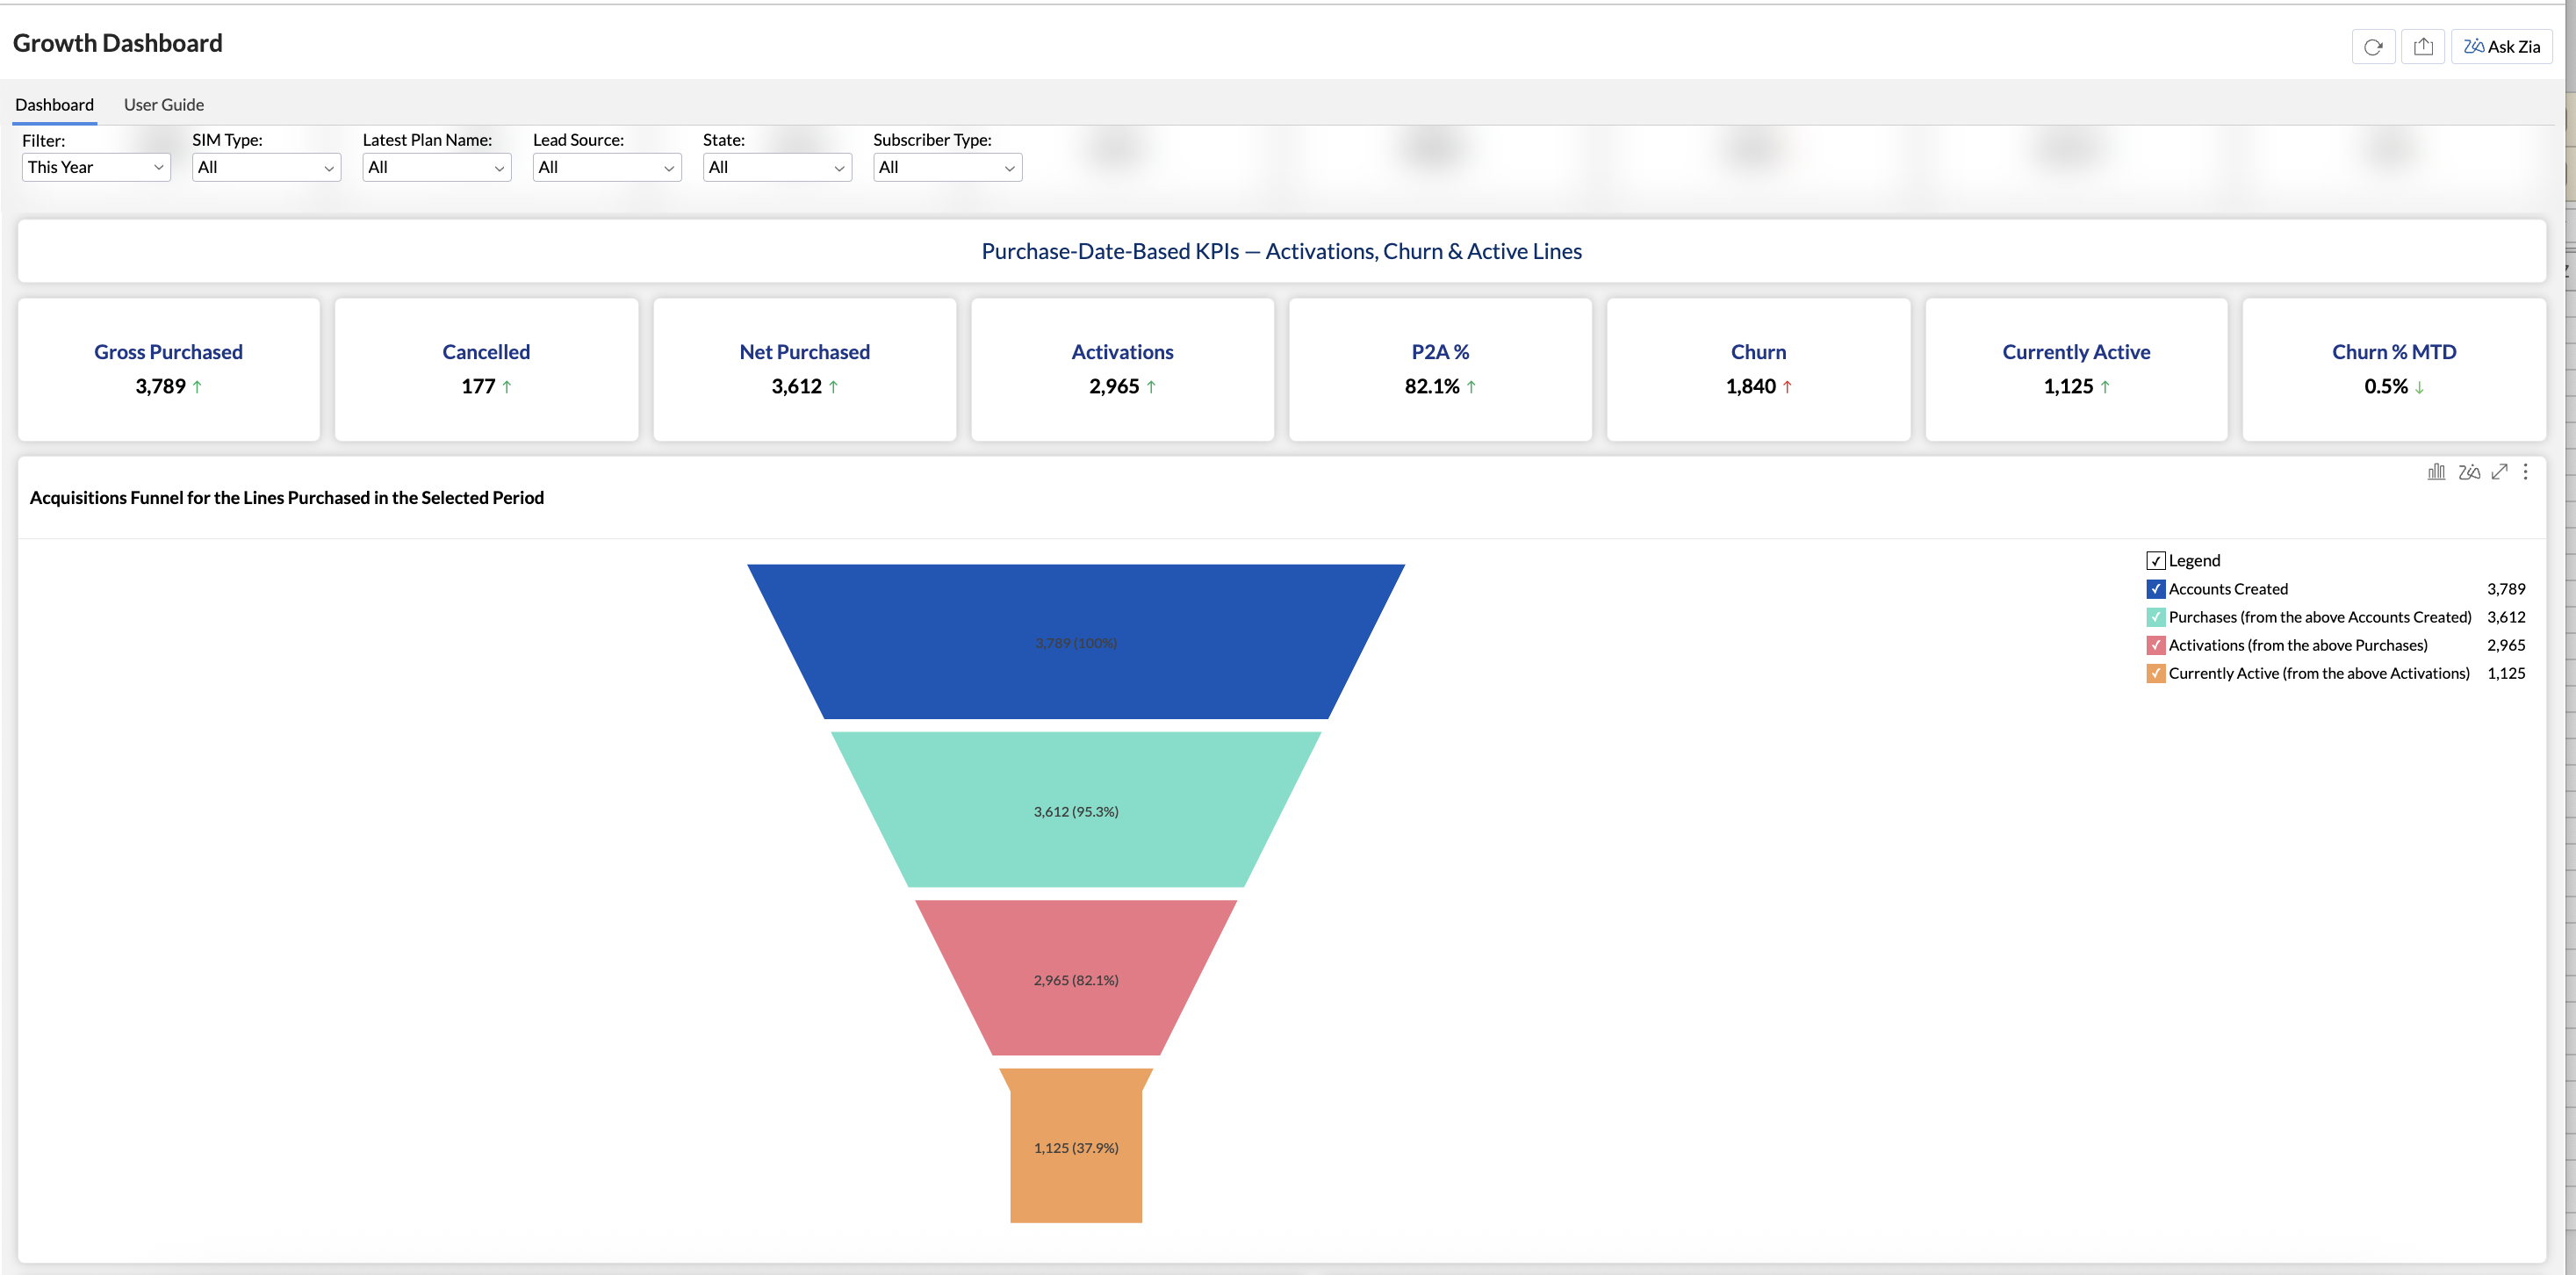
#### Growth dashboard
Subscriber acquisition and churn. Includes gross purchases/activations, active base, and funnel visibility from purchase to activation to retention.
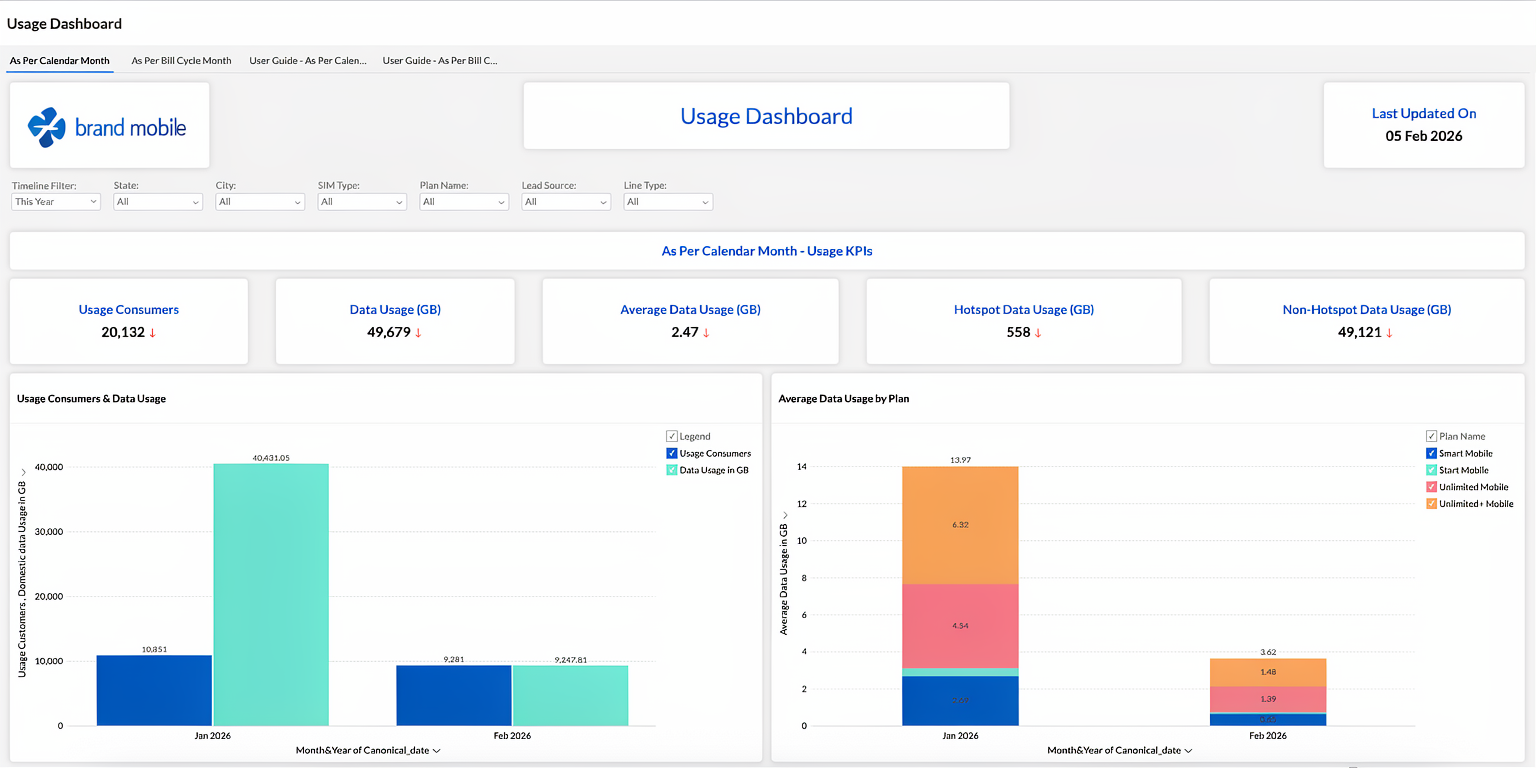
#### Usage dashboard
How subscribers consume services. Includes aggregate usage trends and usage distribution by plan and service.
#### Revenue dashboard
Commercial performance over time. Includes revenue trends, revenue by plan/service, and month-to-date (MTD) and cumulative views.
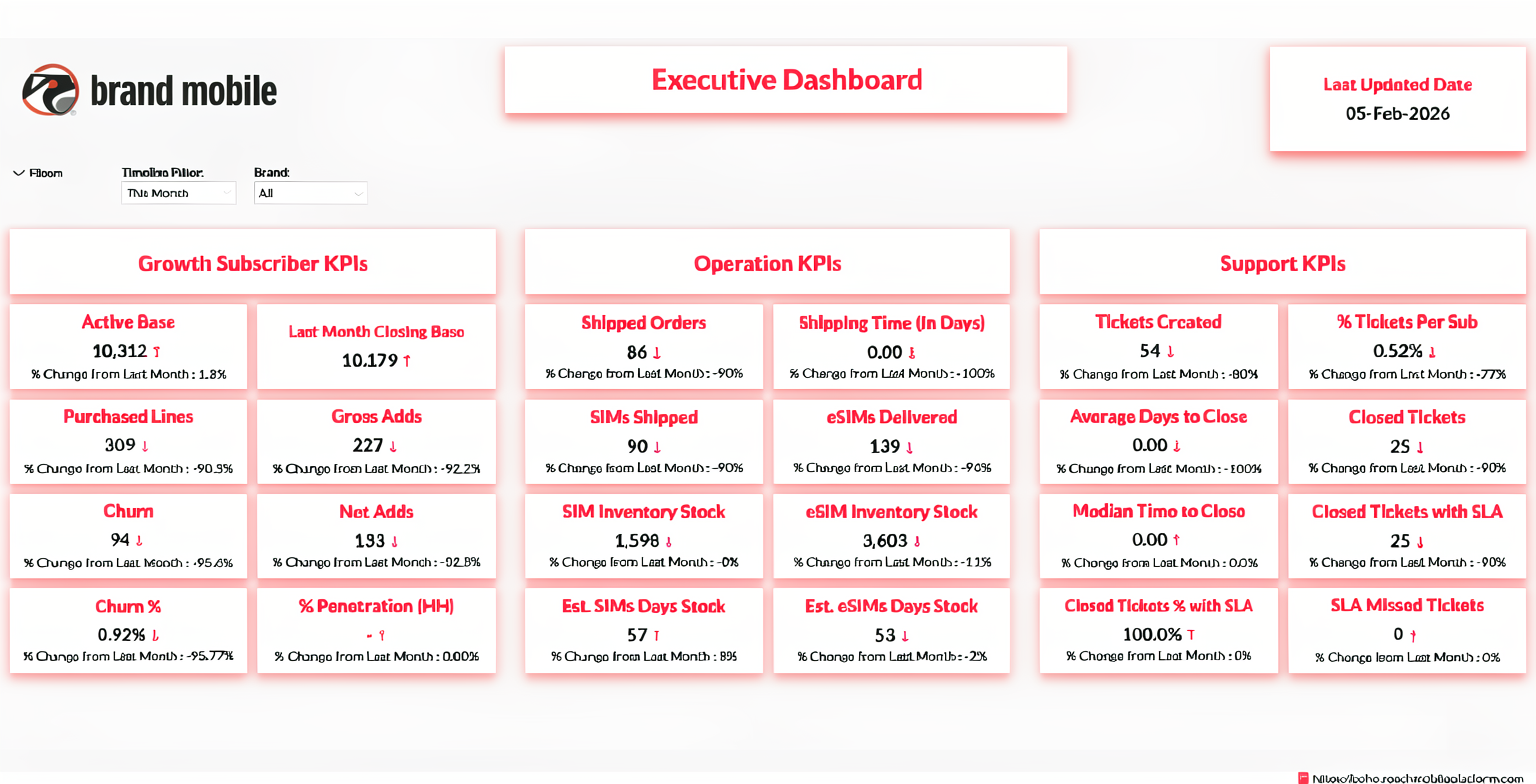
#### Executive dashboard
High-level snapshot across activations, churn, active base, and revenue summary.
#### Feature funnel view (where applicable)
Lifecycle and feature funnel analysis. Availability depends on data readiness. It complements standard dashboards.
### Standard reports
Standard reports support deeper operational and financial analysis. Reports can be viewed or downloaded based on permissions.
Reports are delivered on **defined cadences** such as daily, weekly, or monthly. The set is consistent across Reach Platform brands, with minor variations based on enabled features.
**Terms used**
* **MTD**: month-to-date
* **ILD**: international long distance
* **IR**: international roaming
#### Subscriber reports
Subscriber-focused reporting for base health and movement. Use this set to monitor subscriber status, gross adds, churn, porting, and plan migration.
#### Revenue and billing reports
Commercial and billing reporting for reconciliation and performance tracking. Use this set to analyze charges, payments, refunds, discounts/credits, plan revenue and cost, top-ups, and ILD/IR revenue and balances.
#### Collection and remittance reports
Cash movement reporting for finance reconciliation. Use this set to track what was collected and what was remitted over daily and monthly windows.
#### Usage reports
Consumption reporting across domestic usage plus international services. Use this set for daily/monthly summaries and detailed views (subscriber-level) across domestic data, ILD usage, and IR usage (data, voice, and text).
#### Logistics and shipment reports
Fulfillment reporting for SIM and device shipments. Use this set to track shipment activity, order/shipping status, and fulfillment volume trends.
{% hint style="info" %}
Questions or clarification? Reach out to your respective account manager or email us at for help and support.
{% endhint %}
---
# Agent Instructions
This documentation is published with GitBook. GitBook is the documentation platform designed so that both humans and AI agents can read, navigate, and reason over technical content effectively. Learn more at gitbook.com.
## Querying This Documentation
If you need additional information that is not directly available in this page, you can query the documentation dynamically by asking a question.
Perform an HTTP GET request on the current page URL with the `ask` query parameter, and the optional `goal` query parameter:
```
GET https://docs.reachplatform.com/operations-and-reporting/standard-reports-and-dashboards.md?ask=&goal=
```
`ask` is the immediate question: it should be specific, self-contained, and written in natural language.
`goal` is optional and describes the broader end goal you are ultimately trying to accomplish on behalf of the user. GitBook uses it to tailor the answer towards what is most useful for that goal.
The response will contain a direct answer to the question and relevant excerpts and sources from the documentation.
Use this mechanism when the answer is not explicitly present in the current page, you need clarification or additional context, or you want to retrieve related documentation sections.